Data
S2 Data
Aligned to the NSW Syllabus for The Australian curriculum (https://educationstandards.nsw.edu.au/wps/portal/nesa/home)
- outcomes and content listed below
- outcomes and content listed below
Using Birthdays in Maths - Australian Curriculum

|
Collecting and Displaying Data - Australian Curriculum

Create a graph - pie chart - nces

|
Create a graph - nces

Interactive Pie Chart - shodor

Image by OpenClipart-Vectors from Pixabay
|
|
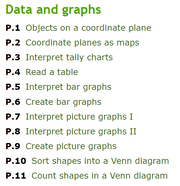
Data and Graphs - ixl
|

|
Worksheets from Twinkl - (joining fee)

|
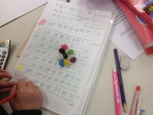
Monster's Favourite Food - abc education

|
Data & Graphing - education.com

|
Syllabus Outcomes
MAO-WM-01 Develops understanding and fluency in mathematics through exploring and connecting mathematical concepts, choosing and applying mathematical techniques to solve problems, and communicating their thinking and reasoning coherently and clearly
MA2-DATA-01 Collects discrete data and constructs graphs using a given scale
MA2-DATA-02 Interprets data in tables, dot plots and column graphs
MA2-DATA-01 Collects discrete data and constructs graphs using a given scale
MA2-DATA-02 Interprets data in tables, dot plots and column graphs
Content
Data A
Collect discrete data
Select and trial methods for data collection
Collect discrete data
- Pose questions about a matter of interest to obtain information that can be recorded in categories
- Collect data from identified sources
- Predict and create a list of categories for efficient data collection in relation to a matter of interest
- Create a list or table to organise the data
- Construct column graphs (with scale intervals of 1) and dot plots using relevant software where appropriate
- Mark equal spaces (intervals) on axes, name and label axes and choose appropriate titles for column graphs
- Describe and interpret information presented in tally tables and column graphs
- Investigate how data is interpreted to make decisions
- Represent the same dataset using more than one type of display and compare the displays (Statistical reasoning)
Select and trial methods for data collection
- Create a survey and related recording sheet, considering the appropriate organisation of categories for data collection
- Refine survey questions as necessary after a small trial
- Conduct a survey or make observations to collect categorical or numerical data
- Compare the effectiveness of different methods of collecting and recording data
- Use a given many-to-one scale to represent discrete data in column graphs
- Use data in a spreadsheet to create column graphs with units on vertical axes that are in multiples
- Interpret and evaluate the effectiveness of various data displays found in media and in factual texts where displays represent data using a scale of many-to-one
updated Feb 2023
|
Please note that these pages contain a collection of links to activities intended to support and enhance classroom teaching and learning. The thumbnails and activities are the property of the authors/creators and are available due to their generosity in sharing their work.
|
All external links are intended for educational purposes only. The curator of this site is not responsible for questionable or controversial content/material which may be found on external sites.
Parental supervision of children's access to the internet and adult previewing of links is highly recommended.
|
